As promised, we’re going to be giving the hosting industry a tool for doing a proper “benchmark” as a means of evaluating your own WordPress capabilities in a standardized way. I’m going to start this post with a few definitions, since there has been a lot of misuse of the words and language in best practices.
The essence of any meaningful benchmark is repeatability. If your test results are changing every time you run them, you are not running a benchmark. A benchmark environment is very tightly controlled and the results should be identical every time you run the test.
Some people may want to compare environments. In order for the comparison to be valid, you must have control over both (or all) of the environments to make very broad conclusions. You may be able to make very specific conclusions, but you need to account for the things that you did not control in your test, and you ABSOLUTELY need to be able to explain any anomalies in the data.
Case in point: It is fairly popular for hosts to run gtmetrix or webpagetest and suggest grandiose claims like “A is 10X faster than B”. However, doing so overlooks simple things like A might be much closer to the geographic location than B. If you are running a test from Australia against a site hosted in Australia and comparing the results against a completely different website hosted in Indiana, it is near impossible to draw any scientifically valid conclusions. The only realistic statement you might be able to make is that users in Australia get better performance from site A than users in Indiana get from a completely different site B… and even then, you’d be overlooking the variability of internet latency, possibilities of DDoS attacks impacting one site or the other while you were testing, peering issues, etc…
So, how do we benchmark?
Well, it starts with an environment, an understanding of what should happen (Benchmarking 101) and some questions. Let’s recount our last two weeks or so of preparation.
Yes, I said two weeks…
For this exercise, LiteSpeed was looking to get an idea of how our LSCache plugin for WordPress would compare to the most common Apache + WordPress cache solution (WP SuperCache). As it turns out, I also write a WordPress blog, so we downloaded my blog via WordPress’ export function and installed it in both environments. Throughout this blog post, I will mention assets that you will be able to download from a repository that we are building so that you can run the exact same tests that we run in any environment you’d like. The entire process will be documented in such a way that you should be able to follow it and modify it to fit your own needs, should you desire.
When you are preparing to publish, it really helps to keep a notebook. It’s also an extremely valuable exercise to include various members of the team to build consensus and help evaluate “what happened” when you run a test. As a side note, we also uncovered two or three things that didn’t work the way we expected in our admin panel, and managed to get them fixed. Who knew that benchmarking could uncover bugs? 🙂
My team for benchmarking includes:
Kevin (Lead WordPress plug-in developer)
George (LiteSpeed WebServer Architect)
Mike (Lead WHM plug-in cache management developer)
Rob (Social Media/Documentation lead)
Jackson (Support/environment Manager)
Jon and Mark (Test Environment admins)
Steve (me… performance benchmark guy or marketing/BD lead…depending on the day)
So, why is benchmarking a big deal here at LiteSpeed?
We want to be the fastest solution for the Internet. If we are not, we need to understand where and why to continuously improve our products. This is an all-hands effort because it supports our core mission, and there is nothing more important to our company than being the best. (OK,I’m going to take the marketing hat off and go back to engineering 🙂 )
Our test tool of choice for benchmarking is LoadRunner. It is a tool that I have been personally using for 17 years, and I have a wealth of contacts in industry if/when I need help. More importantly, I know that LoadRunner works in all of the possible test conditions and I don’t need 5 tools to do my work. LoadRunner Community Edition is completely free for anyone to use. We extend it with SiteScope for LoadRunner Community Edition to gather system level data while running the test, but we also have our team looking at traditional tools like TOP, Apache logs, etc. to do sanity checking.
Sanity checking?
Sanity checking is a double blind testing method of flushing out errors in your test environment. As an example, Jon and Mark will shout out the Server Load numbers from the CentOS console while I validate that the SiteScope data generally agrees. Mike will open a browser window and randomly click on the WordPress articles in our test site to see if the results match what our tool is reporting.
And here is the rub: They do not always match. When they do not match, you need to fix something.
And now you know why we’ve had 7 people working on this off and on for two plus weeks. We’ve been fixing problems in the test environment in preparation to run the benchmarks. Our last runs were almost “clean”. What does clean mean? Clean means that there wasn’t anything in the data that couldn’t be easily explained and didn’t follow the mathematical model exactly. Clean also means that we are getting the exact same results when we re-run tests.
Clean means repeatable. (Every benchmark in this article was run multiple times to confirm that the results did not change between runs)
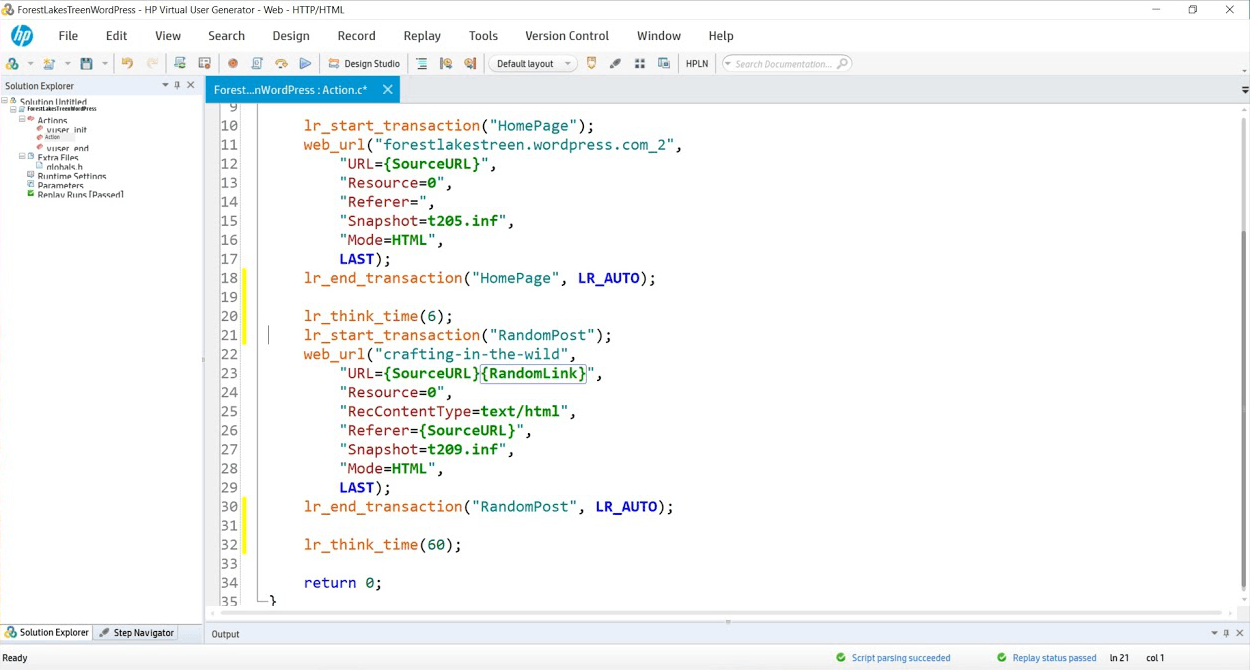
We started with a WordPress (version X) site running on CentOS 7 [2 CPUs with 4 cores and 4GB of memory] (Full spec hyperlink). The site contains a home page that greets the visitor and 15 articles. I wrote a script that simulates someone coming to the site, and then randomly selecting an article to read. In our load testing software, we have the ability to run up to 50 concurrent users. Developing the working script took less than an hour, and a link to it along with the various scenarios we execute and result sets will all be provided at the bottom of this post.
So why has this taken two weeks?
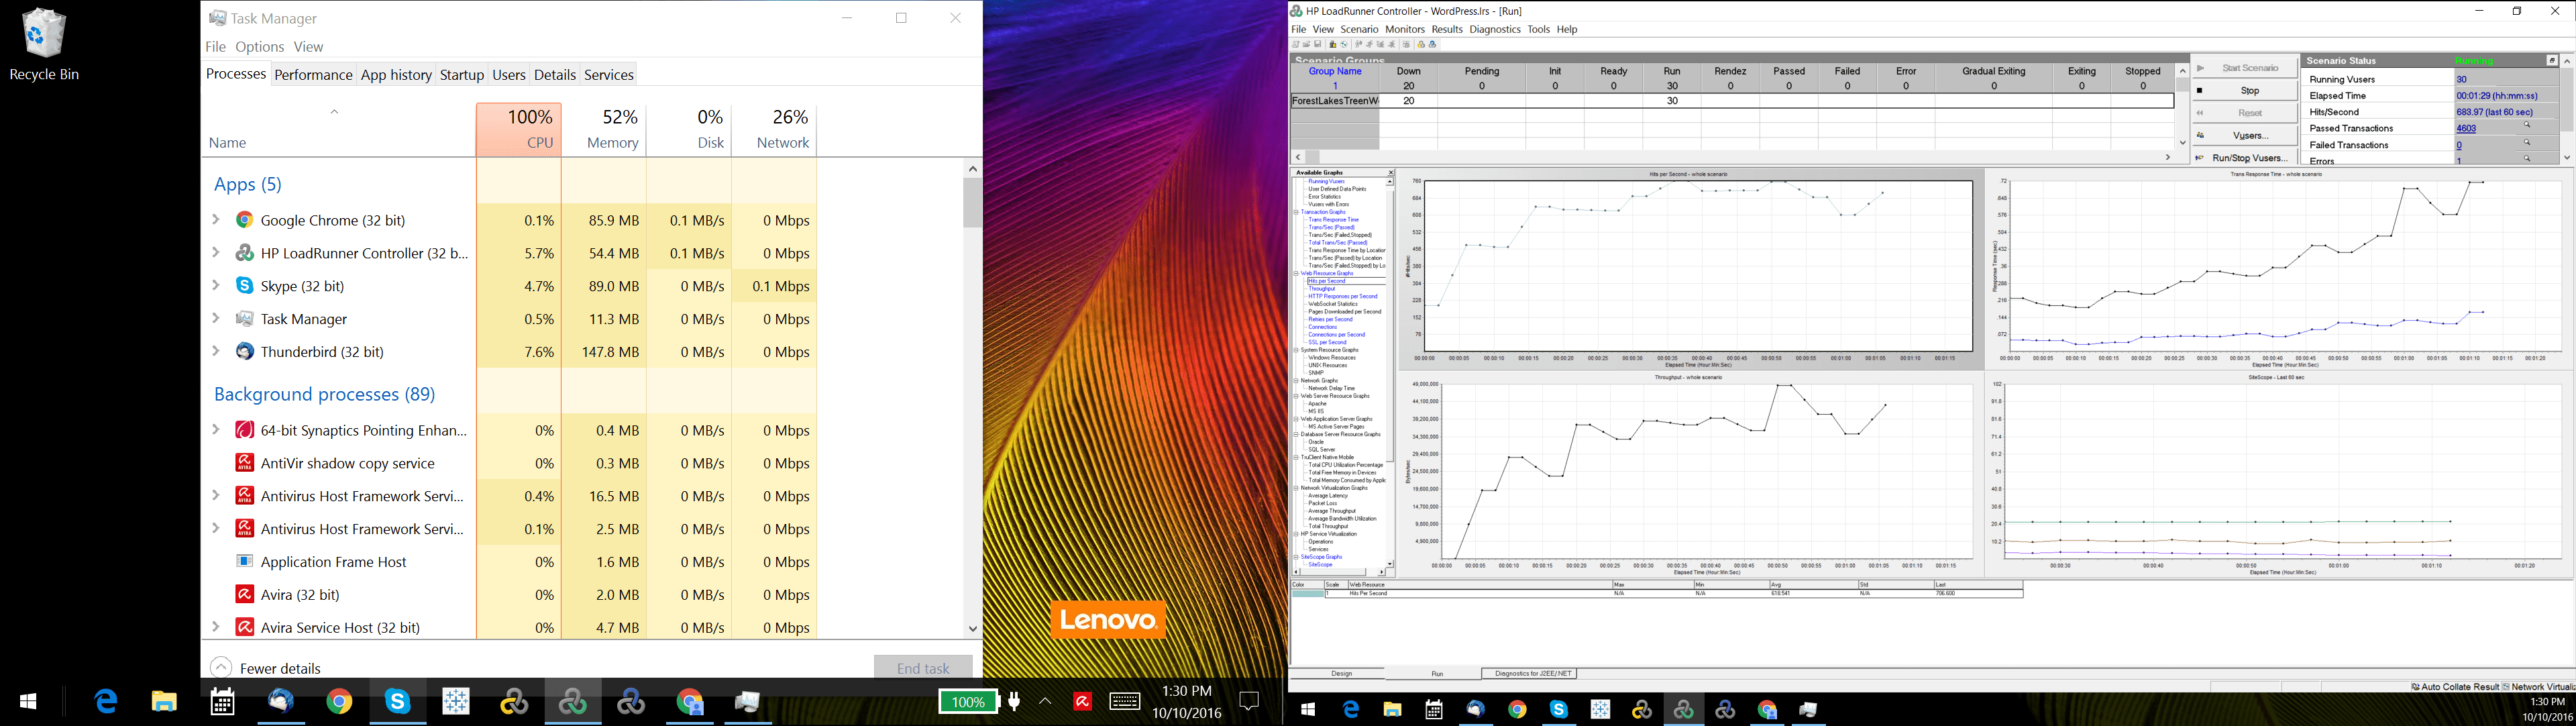
Well… this might take a second. Before you benchmark WordPress, you need to benchmark your script and your test environment. That’s right. Benchmark your testing software first… and flush out environment issues. As an example, our load generators were Windows 10 VMs and our throughput was terrible because they were consuming a lot of CPU. In addition, the network bandwidth would stop climbing at around 200MB/s. As it turns out, Windows Defender was scanning every packet request which caused the high CPU utilization and limited bandwidth…somewhat.
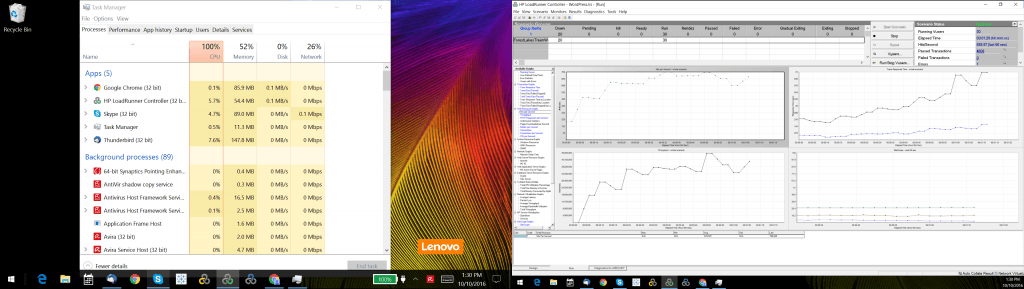
Next, investigation revealed that there was another bandwidth issue from outbound calls to Google for fonts in the page, saturating our internet connection. We turned off font calls and other outbound calls in the WordPress theme and our load generators scaled better. We tuned the TCP stack and were soon able to generate 4Gb/s per load generator, which gave us the ability to sustain 8 Gb/s. While we were connected to a 10Gb/s switch, we believe there was some bandwidth loss due to virtualization and we were never able to generate the full 10 Gb/s. As an independent verification step, we also ran iperf and got similar results. Whatever the cause, we know we are limited to 8Gb/s maximum.
litespeedtech.com/packages/benchmark/LoadRunner/WordPress/2016/network8-9Gb/Report.htm
When an internet user visits a website, their browser will open multiple connections to speed up the movement of data. Some tools bypass this to conserve resources, only opening one connection to download a cached page, but then avoid sending the content via the other connections simulating a browser. We will run a test this way to illustrate why the results are not very meaningful. Most testing tools also allow you to make changes to the run-time settings that can impact what you are testing and what the subsequent results mean. We’re going to discuss those settings and how we incorporate them into our benchmarks.
That’s right. Plural. Benchmarks.
There is no one single benchmark that you can run that explains everything about the system. You will always be constrained by what is built, usually not by what is possible. We run a multitude of tests as a suite for describing system capabilities, and with good reason.
It is prohibitively expensive to test maximum capabilities.
WordPress is approximately 30% of the internet, so I will assume that they’ve done enough work to be able to build a low volume website like my blog. However, when a WordPress site has a significant audience, performance is not guaranteed. Like any PHP application, WordPress will bog down when you have a lot of users hitting PHP, so caching is popular to offload PHP workload. Instead of running 10,000 users in a test, which would require expensive licenses and hardware to drive the load, many people simulate via a high transaction rate. This method is not perfect, but it does allow you to understand transactional throughput. Transactional throughput is not user load, and if you see a benchmark that suggests that the two are equivalent, you should probably not pay too much attention to it.
Since this benchmark is about WordPress and two web server/caching options, your first thought might be to batter both systems with your max load and see what happens! [hint: this isn’t very useful- unless you are trying to convince someone that they shouldn’t do it…]
An example of a poorly defined test plan reads something like this:
“We ran a 50 user test against two WordPress environments to see which one performed better.”
In order for a requirement to be testable, you need to state a lot more specific information. Our example definition below remains incomplete, but for the purposes of this article will serve to illustrate how much further one needs to go to become “testable”
We’re going to break our requirement into components, and then make sure that the tooling and the environment are set-up correctly to handle the test we are attempting to run:
A Test Plan comes to Life:
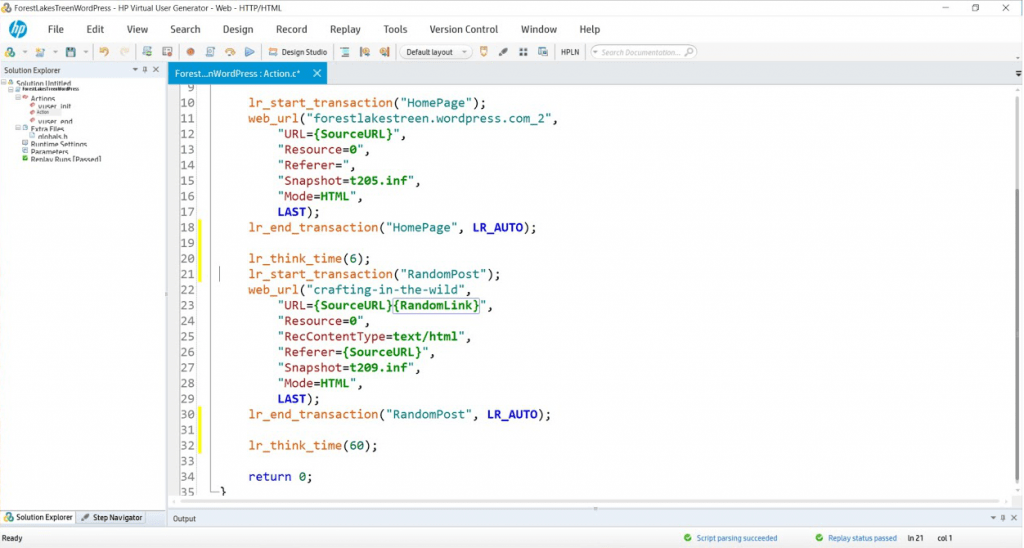
Simulate 50 concurrent users running a script that hits the WordPress landing page and then randomly selects a blog link to read. In our scripts, lr_transaction statements capture transaction times for pages and store the results for analysis. We will measure the WordPress Home Page and then a randomly selected blog post throughout the duration of the tests we perform. We’ve created two variables
{SourceURL}, which can be edited to store an IP or server name should you wish to test in your own WordPress domain.
{RandomLink}, which contains the 15 articles and randomly picks one per user per iteration. If you wanted to simulate a larger collection of cached objects, you could create more articles and simply append their paths to the text file that serves as a data repository for this variable.
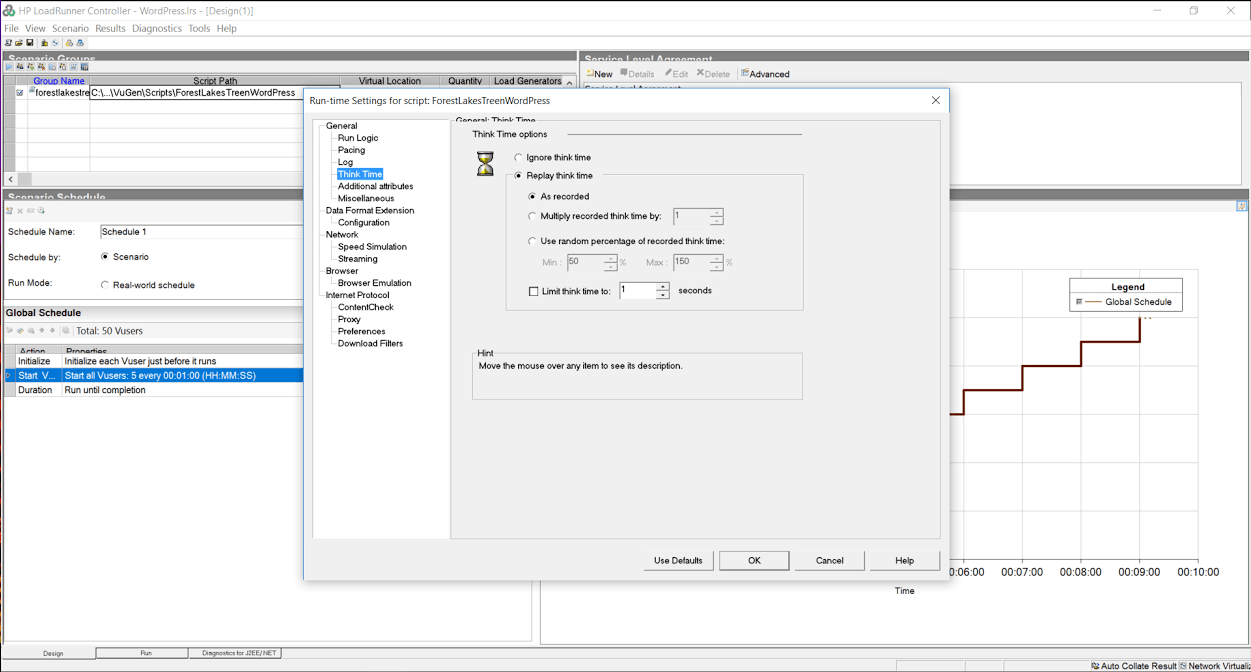
While think time was recorded at 6 and 60 seconds, we have edited it to 1 second in both cases to gather more data rather than having the system sit idly for 99% of the test.
During this suite of tests, we will:
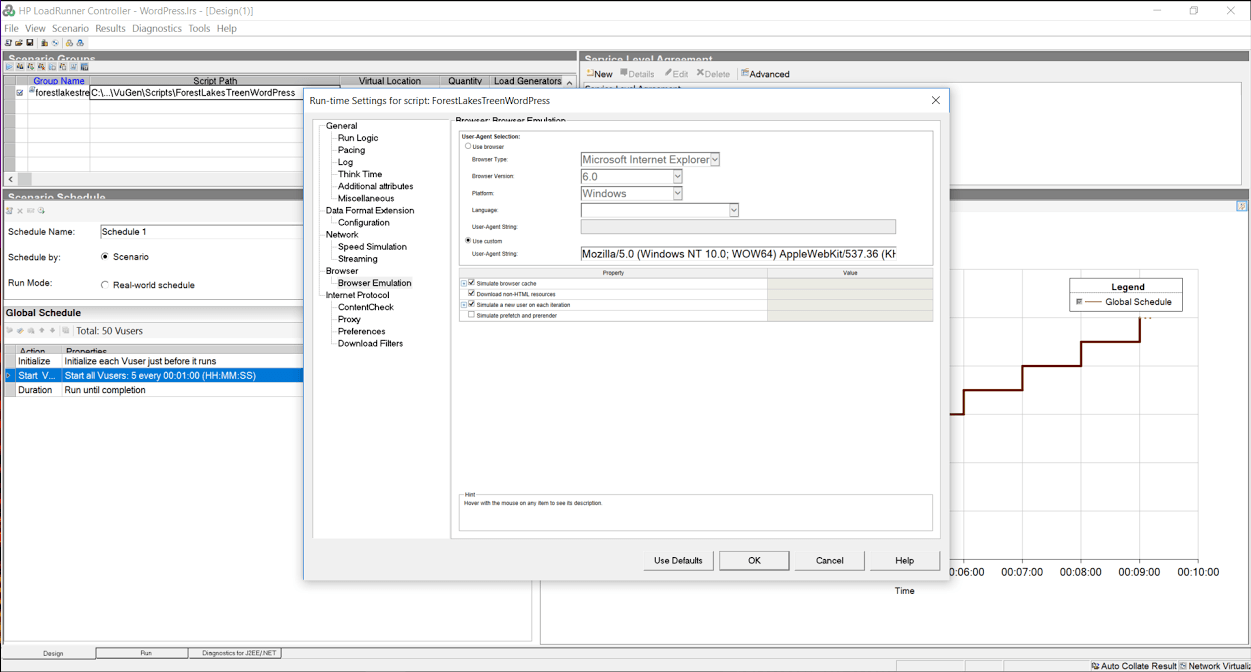
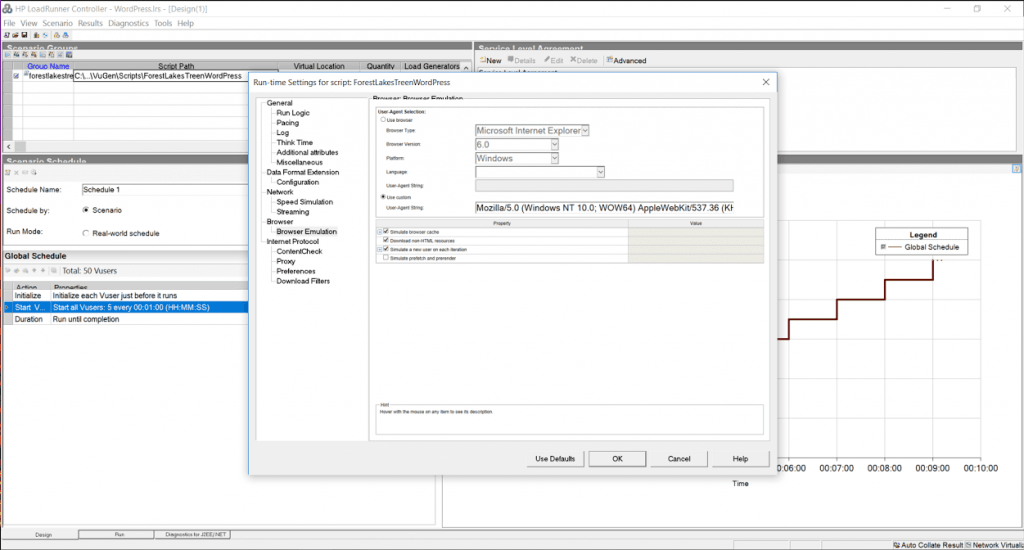
Turn off HTML Parsing to avoid downloading resources with no think time to test the cache’s capability to create and close connections.
Turn on HTML Parsing to download resources with no think time to simulate a high volume event and to test the cache’s ability to work with a server load of a real WordPress site serving pages from cache.
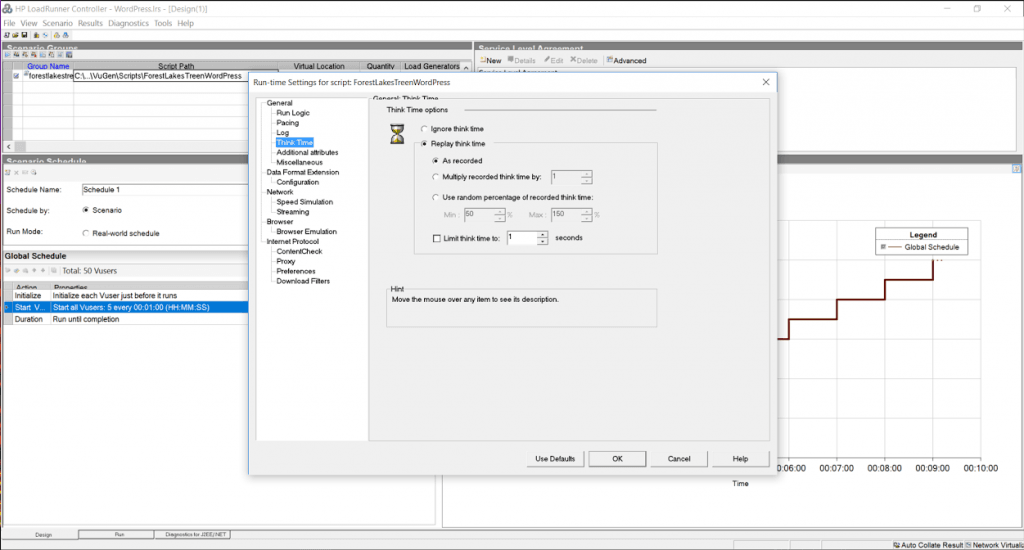
Turn on HTML Parsing to download resources and replay think time typical of a real WordPress user to simulate a real world workload on a cache.
Assumptions:
- System should not fail to respond to any transactions.
- All pages will be served from cache (cache warm-ups prior, if necessary).
- Page load speeds should remain relatively consistent for the duration of the test.
Since both environments will be exercised with only cached content, every request will be served from cache in both Apache and LiteSpeed. During the test, we will attempt non-cached transactions like adding comments or logging in to the WordPress Admin panel and observe the effects the load has on the overall system. We will use the same script in the various exercises, only changing the run time settings to simulate different conditions.
In our tool’s runtime settings, we have the option to turn off the parsing of the cache served page so that it does not download resources, or pull them from the local browser cache. Simulating the browser behavior of downloading resources puts more load on the server, and also helps us measure throughput or the ability of the web server/cache to move data across the network.
In addition, when the script is recorded, it saves the amount of time a typical user spends reading the page into “think time”. As you might imagine, an average WordPress post has a significant amount of think time in it. By ignoring think time, we get a much higher load than replaying think time, which can help us stress test the environment… but is that what we want to do? [Maybe.]
Debugging and Benchmarking Begin
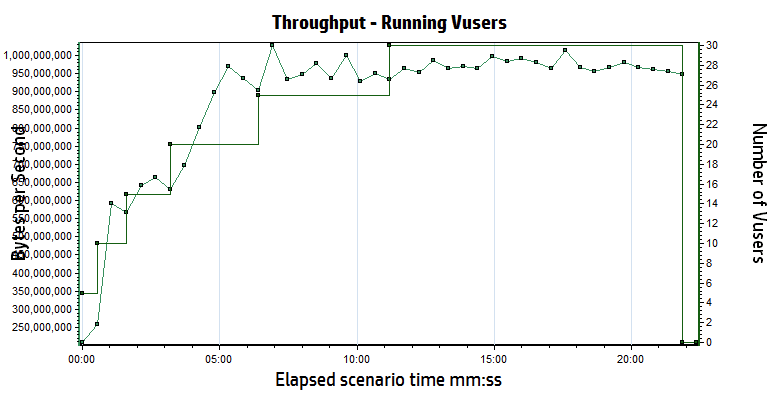
I’ve already discussed the model in the original performance blog (Benchmarking data looks like this…), and as a reminder, the tests should basically draw straight lines. When they do not, something is broken. To start, we want to know the characteristics of a single user running with no think time and downloading resources, since this will be our maximum load.
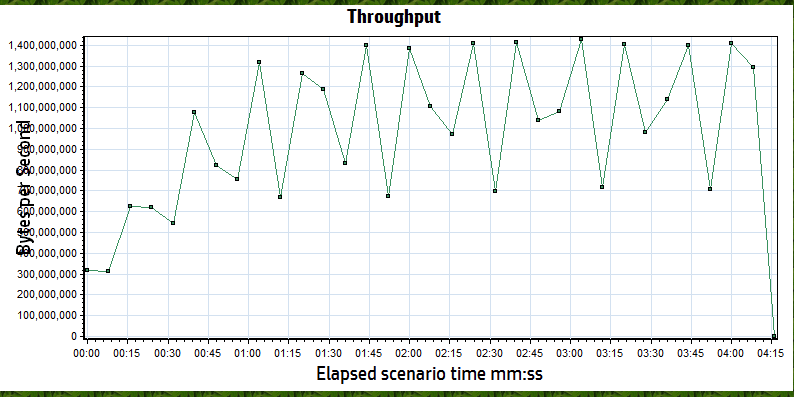
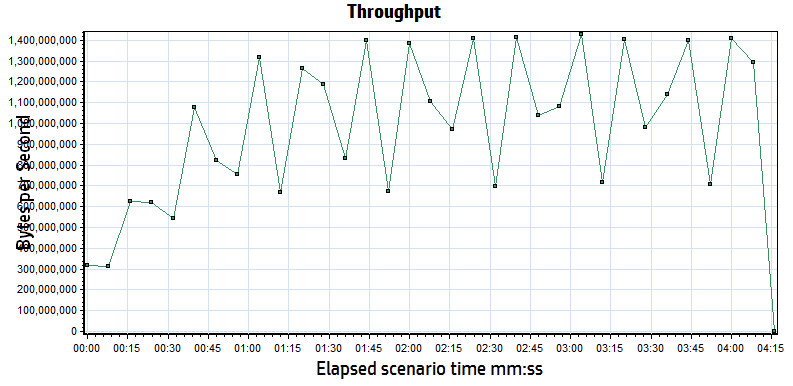
Both Apache and LiteSpeed perform about the same in these conditions. A round estimate for throughput is that each user will consume about 90 MB/s or 0.4 Gb/s of bandwidth and generates about 1500 hits/sec. With a maximum of 8Gb/s of available bandwidth, we know that we cannot use all 50 users to run our test (rough estimates are ~20 users will saturate the network). This graph confirms that the network saturates around 5 minutes mark and somewhere around 20 users because the throughput no longer increases as the number of users grows.
Let’s do some quick math to double check our work.
If we run one user, we see about 11ms response time, which would translate to approximately 90 requests for any page per second (1s/11ms). If you look at most of the articles you’ll see that most contain “about X-teen resources” per page, so your hits per second should be 90 times X-teen, which matches our 1500 hits per second.
Here is the most important point: THIS MATH IS ALWAYS TRUE. It does not matter if the site is WordPress, Magento, or just PHP. Hits per second = (1s / single user page time) * average number of resource per page. If you turn off the downloading of resources, your average number of resources per page will be one (just the cache reply) …but the single user page time will probably drop to 1-3 ms.
Believe the math.
Low Load Baseline (5 users)
When you are benchmarking, you are not trying to stress a system to its breaking point. You only want your system to respond as fast as it can, and that stops happening when you start approaching breaking points. While a single user response time is good for some things, it doesn’t create any of the deadlock conditions that a multi-user baseline will. Since LiteSpeed and Apache should both handle 5 users without issues, we start with 1 user and ramp up to 5 users by adding 1 user every 30 seconds. In a second I’ll explain why this didn’t happen the way we expected.
We use the script to hit the test site for a minute or two, just to make sure that everything is cached, then we start a 5 minute test cycle. During the baseline tests, we planned to run three slightly different scenarios:
Scenario #1: cache hits only, think time of 1 second between pages, downloading of resources
Scenario #2: cache hits only, no think time, downloading of resources
Scenario #3: cache hits only, no think time, no downloading of resources
When it is done, we swap the LiteSpeed configuration for the Apache configuration… Lather, rinse, and repeat.
litespeedtech.com/packages/benchmark/LoadRunner/WordPress/2016/apache-baseline/Report.htm
litespeedtech.com/packages/benchmark/LoadRunner/WordPress/2016/nginx-baseline/Report.htm
litespeedtech.com/packages/benchmark/LoadRunner/WordPress/2016/litespeed-baseline/Report.htm
Replay Think Time/Download Resources
|
Completed Trans. |
Hit/s |
Throughput |
Tx Home/Random |
Server Load |
| LiteSpeed |
1733 |
70 |
3.3 MB/s |
0.007/0.010 |
0.026 |
| nginx |
1778 |
60.5 |
3.7 MB/s |
0.011/0.016 |
0.157 |
| Apache/WPSC |
1776 |
70 |
4.3 MB/s |
0.013/0.015 |
0.055 |
No Think Time/Download Resources
|
Completed Trans. |
Hit/s |
Maximum Throughput |
Tx (s) Home/Random |
Server Load |
| LiteSpeed |
221 K |
7511 |
674 MB/s |
0.007/0.009 |
1.12 |
| nginx |
130 K |
4428 |
501 MB/s |
0.013/0.014 |
1.37 |
| Apache/WPSC |
105 K |
3568 |
424 MB/s |
0.015/0.019 |
13.48 |
What happened to the third test (no think time, don’t download resources)? We decided that there was very little reason to run it, because there is a problem that surfaces in this first test, which completely caught us off guard. Apache cannot scale in this environment past approximately 3200 h/s. Period.
Notice the wording “in this environment”? That is a very specific statement. It is only relevant to this 2 CPU server, but we have seen the exact same behavior with other applications- so it has nothing to do with WordPress. We are saying (with a high degree of confidence) that Apache becomes CPU bound around 3200 hits/sec… regardless of what the hit is. The same behavior occurs at 3200 hit/sec with downloading full pages or just cache responses in a 2 CPU environment. It is a limitation of Apache and can only be addressed via adding more resources.
If you look at the data with think time enabled, even a minimal 1s delay between requests drops the transaction rate to only 70 hits/sec. A hit is any request for any object (static or cached) being served by apache and/or LiteSpeed. The difference between the two in a low volume environment is negligible. If your WordPress site does not get a lot of traffic, you will not see any improvement running LiteSpeed.
But, please, keep reading…
The second test actually exposes the Apache problem. By removing the think time, you can simulate a much higher workload with the same number of users. The LiteSpeed Server delivers 8200 hits/sec, while the Apache workload peaks at about 3200 hits/sec (You’ll see this in the final data sets too). Take a look at the server load. Apache is running at 8X capacity, which results in requests being briefly queued by the processor and the longer response times in both Home Page and Random Page transactions.
For the record, LiteSpeed capped at 16,000 hits/sec, but we were at the limits of everything (bandwidth, load generation capacity, LiteSpeed capacity…). There were peaks that were higher, but 16K sustained was held for nearly 10 minutes.
Now, normally, this is the part in the effort that vendors would generally throw a celebratory high five and proclaim their awesomeness… but, let’s hold the applause. When you are 5X as scalable as your competition, that’s huge!
Except the data tells a weird story.
Under no load conditions, LiteSpeed and Apache perform about the same.
AND…
Under 1X vs. 8X load conditions, LiteSpeed and Apache perform about the same.
And, that is 100% correct… Almost.
While the Apache server is running at 8X load, you see a slight increase in the time that the pages get served by the cache. 5ms. Throughout the test, we would open browser sessions and independently hit pages on the site. Guess what. They were fast.
The one hidden nugget in all of this is that the server load is not the same. The cache is fine, and able to respond, even though the server load is high. However, all uncached requests are occurring against a server that is dying. We tried logging into the root of the server, the WordPress Admin panel, and adding comments. Guess what. They were not fast… 30 seconds or more.
This also explains why I hold webpagetest, gtmetrix, et. al. in such disdain. They test at low volume and they ignore the effects on the back-end web server. If you ignore load conditions and back-end system resources, everyone gets a trophy… Until the real world comes for them. Interestly enough, Internet Sucuri published a blog post about Layer 7 DDoS attacks and you’ll notice that the median attack size is very similar to… The Apache limit we demonstrated earlier. (Sucuri Layer 7 DDoS Blog). If nothing else, LiteSpeed buys you 4-5X more Layer 7 DDoS resiliency.
So, what next?
We better run a much bigger load against both servers to see what happens!
We will rerun scenario #1 and scenario #2 with 5 users being added every 30 seconds in an attempt to reach the limit of 50 users in both scenarios. Scenario #2 may cause issues.
Scenario #3 is officially retired (Siege-like) because …well, it doesn’t make sense. Please understand that if you are using Siege, you are not requesting resources unless you explicitly code every object on the cache page into a get request for every page within your WordPress site. You can use Siege, but you’d need to write a script that called the cache page, and then called every bitmap, CSS, and javascript object on the page to represent a user with a browser. For every page. Just not maintainable.
Without downloading resources, you might as well test “hello world”…
Replay Think Time/Download Resources
|
Completed Trans. |
Hit/s |
Throughput |
Tx Home/Random |
Server Load |
| LiteSpeed |
21292 |
503 |
32 MB/s |
0.013/0.026 |
0.205 |
| nginx |
21484 |
535 |
33 MB/s |
0.012/0.014 |
0.60 |
| Apache/WPSC |
21122 |
527 |
39 MB/s |
0.022/0.037 |
1.961 |
litespeedtech.com/packages/benchmark/LoadRunner/WordPress/2016/apache-with-think-time/Report.htm
litespeedtech.com/packages/benchmark/LoadRunner/WordPress/2016/nginx-with-think-time/Report.htm
litespeedtech.com/packages/benchmark/LoadRunner/WordPress/2016/litespeed-with-think-time/Report.htm
No Think Time/Download Resources
|
Completed Trans. |
Hit/s |
Throughput |
Tx (s) Home/Random |
Server Load |
| LiteSpeed |
334K |
12K |
738 MB/s |
0.048/0.055 |
1.6 |
| nginx |
236K |
6K |
363 MB/s |
0.090/0.094 |
1.8 |
| Apache/WPSC |
93K |
3400 |
300 MB/s |
0.217/0.151 |
91.0 |
litespeedtech.com/packages/benchmark/LoadRunner/WordPress/2016/apache-no-think-time/Report.htm
litespeedtech.com/packages/benchmark/LoadRunner/WordPress/2016/nginx-no-think-time/Report.htm
litespeedtech.com/packages/benchmark/LoadRunner/WordPress/2016/litespeed-no-think-time/Report.htm
MAX
litespeedtech.com/packages/benchmark/LoadRunner/WordPress/2016/litespeed-saturated/Report.htm
Once again, with think time, both environments performed about the same. However, Apache running on 2 cores performance is saturated and becoming CPU bound, even though the transaction rate is nowhere near the 3200 hits/sec limit. Whenever you begin to run out of resources, the natural response is to add more resources. However, Apache’s CPU consumption is not linear at all, and doubling the amount of CPU’s would not double capabilities.
Both environments performed well and most likely would be good choices for low volume WordPress hosting, but there is nothing equivalent about them. While 200 ms may be acceptable, a server load of 91 is an operations nightmare. LiteSpeed Web Server is seeing DDoS level hit rates, and still performing very well.
We know that you can build sites that support many more readers by adding additional Apache servers, or perhaps larger servers. We’re a little disappointed in the fact that we cannot really “go big” on this because we all want to know how far we can go here at LiteSpeed. We’re always looking to push the engineering further.
Drawing conclusions
Final thoughts from a “benchmark suite”…
Going through this exercise has been very helpful. We discovered some things we didn’t know. We confirmed some things that we thought we knew. We also corrected some things we were doing wrong.
My personal takeaways are:
While LiteSpeed would love to have every WordPress user as a customer, the truth is that if your site has low volume, then you shouldn’t expect much of a performance gain from running our software. We are working on some things that will change my opinion on the topic greatly, but for now, LiteSpeed really only helps at higher volumes and will likely help you if you are a Layer 7 DDoS victim.
Assuming that you are operating a high volume WordPress hosting business, the case for LiteSpeed is pretty clear. Shared hosting providers can easily double their WordPress hosting capability by upgrading to LiteSpeed. If you write a WordPress blog with light traffic like mine, you are likely paying very little (I’m paying nothing), but you are also very likely grouped with hundreds of people like me in the shared environment. The aggregate load of these hundreds of WordPress blogs could result in death by a thousand paper cuts, or even worse, a hundred support calls/tickets from angry WordPress bloggers.
As a final test, I turned up all of the real user features within the tool (realistic think times and browser side caching) and I reran 50 users against the Apache server. The peaks were about 70 hits/s and 7MB/s. This underscores a very important point. Real user loads are significantly lower than simulated loads because real users need time to think, which in turn gives the server time to think. Assuming that the math is a straight line, you could safely scale Apache to nearly 40X this real user load, or about 2000 active users reading WordPress articles. Similarly, the math for LiteSpeed would suggest about 20,000 real world active users interacting with a WordPress server in typical fashion. Real world active users do not mean concurrent users, nor logged in and browsing – more an audience/community sizing guideline.
However, it is more likely that you will run out of inbound bandwidth at the host long before hitting the physical limits of the Apache server. A 10Gb/s port on a switch can only send as much data as the smallest network can accept before delays get introduced. Remember that a host only controls what happens inside of their four walls. They do not control the size of the content nor the network on the other side of their switch. One of the first things we fixed was the image sizes in our WordPress test server, because most were 4MB (mostly because I upload them from my phone and I’m lazy). You will ALMOST ALWAYS run into a bandwidth issue as a hosting provider first if your data center wasn’t designed by monkeys.
Bandwidth is finite and expensive. Even the smallest servers are capable of consuming all of your bandwidth, which means that the bandwidth bottleneck will begin to protect the server by throttling the requests to the server. If you don’t have any idea of how much bandwidth per WordPress user your site consumes, forget about making any other claims. In addition, if you haven’t tested it all the way through, you probably missed the opportunity to tune your infrastructure.
From testing for two solid weeks, we were able to flush out some network and server issues that degraded our test environment. We kept copious notes and developed methods and procedures to maximize performance by 400% over the two weeks. Just because Siege suggests that you can move 8Gb/s against your test environment, doesn’t mean you can actually do so and you don’t actually know for sure until you try it.
In looking at Siege output, I noticed it had run for X number of seconds, and moved Y MB. In the end, it calculated that the network had a max rate of transfer of Z Gb/s. The only way you arrive at that conclusion with that scale is by calculation. (MBs cannot become Gb/s any other way). What this means is that you’ve never actually tried to move that much data, and you are assuming that everything is setup correctly and it will just work. Hypothetically.
Our testing suite removes hypothetical to give you real world results that you can use to evaluate where you stand against the physical limits of your infrastructure. It doesn’t matter how expert you are, there are mistakes and/or misconfigurations that can be discovered via testing to improve performance. We are willing to share ANY and all of our test assets and expertise to help you assess LiteSpeed. (email: santonucci@litespeedtech.com)
Keep an eye out later this year when we upgrade our WordPress cache to do some game changing things (and of course, the supporting benchmark blog post 🙂 ).